
Introduction
I was thinking recently about how best to help someone transitioning from Matlab(TM) to R, and did my best to recall what sorts of things I struggled with when I made the switch. Though I resisted for quite a while, when I finally committed to making the change I recall that it mostly happened in a matter of weeks. It helped that my thesis supervisor exclusively used R, and we were working on code for a paper together at the time, but in the end I found that the switch was easier than I had anticipated.
Tips
Don’t be afraid of the assign
<-operator. It means exactly the same thing as you would use=in matlab, as ina <- 1:10 # in matlab a=1:10;except that it makes more sense logically. The only place you should use
=is in logical comparisons likea == b(as in matlab), or for specifying argument values in a function (see number 5).Vectors are truly 1 dimensional. This is different from matlab in the way that you could not add together an Nx1 and a 1xN vector. In R it would be just two vectors of length N. The transpose in R is by doing
t(), and the transpose of a vector (or class “numeric”) is the same as the original.Array indices use square brackets, like
a[1:5] <- 2 # assign the value 2 to the first 5 indices of aThis is one of the things that drove me crazy about matlab, that it used
()for indices as well as function arguments. It makes mixed array indexing and function calls very confusing to look at and interpret.By default arithmetic operations are done element-wise. If you have two MxN matrices (say A and B), and you do
C <- A*B, every element in C is the product of the corresponding elements in A and B. No need to do the.*stuff as in matlab. To get matrix multiplication, you use the%*%operator.Function arguments are named, so the order isn’t super important. If you don’t name them, then you have to give them in the order they appear (do
?functionto see the help page). For example if a function took arguments like:foo <- function(a, b, c, type, bar) { #function code here }You could call it with something like:
junk <- foo(1, 2, bar='whatever')where
aandbare given the values of 1 and 2, andcandtypeare left unspecified. This would be equivalent:junk <- foo(a=1, b=2, bar='whatever')You could also do:
junk <- foo(bar='whatever', a=1, b=2)No semicolons needed (except where you’d like to have more than one operation per line, like
a <- 1; b <- 2In R, the equivalent to a matlab structure is called a “list”. Instead of separating the levels with a
., it is generally done with a$. So the structure of a list could be something like:a <- junk$stuff$whateverUse the
str()command to look at the structure of a list object.Most functions that return more than just a single value will return in a list. Unlike matlab there isn’t a simple way returning separate values to separate variables, like
[a, b] = foo('bar'). For example, using the histogram function:a <- rnorm(1000) h <- hist(a)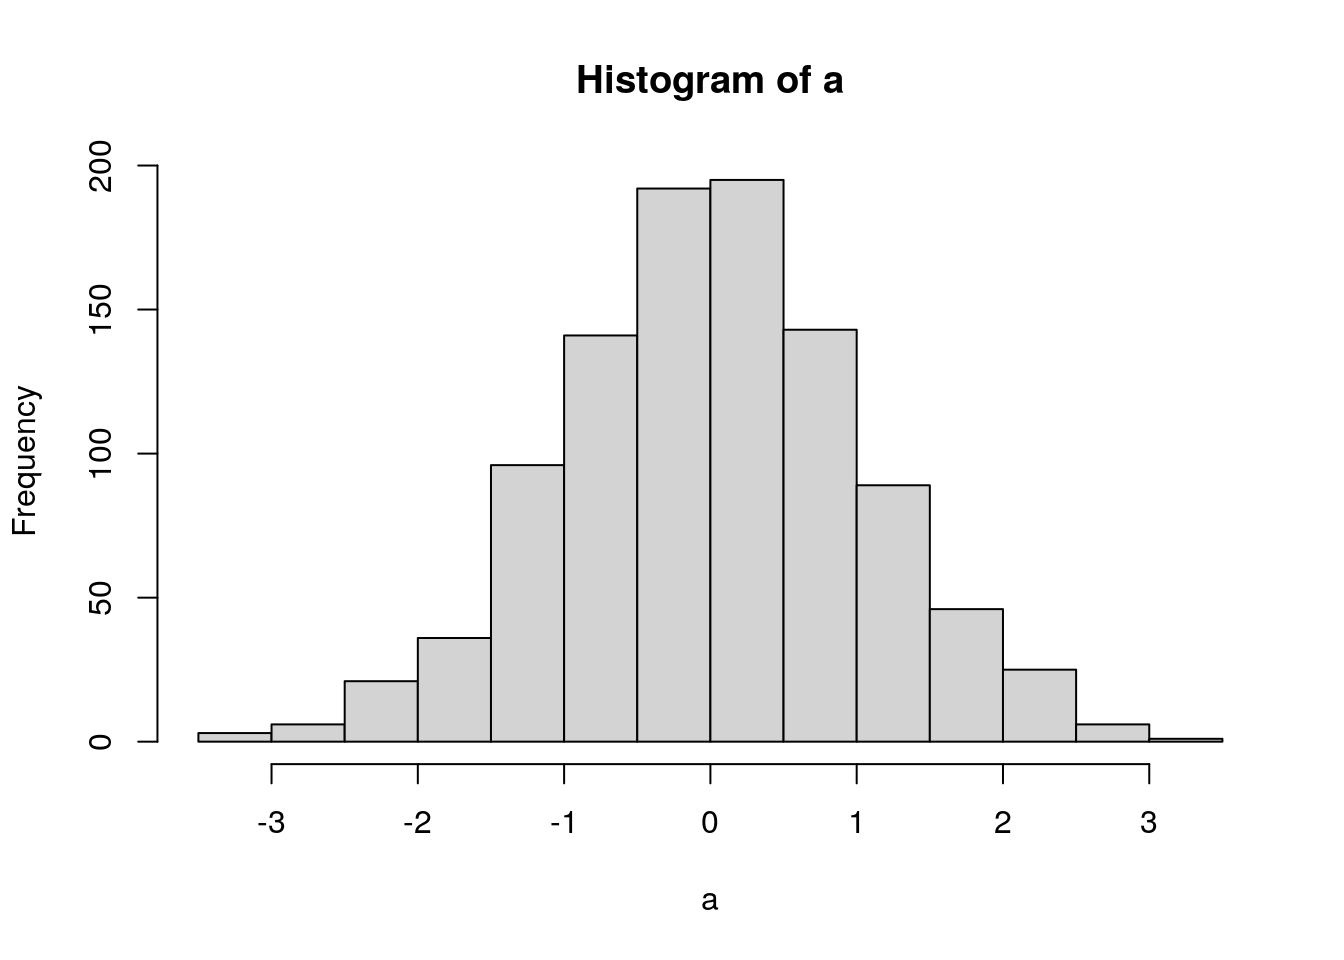
str(h)## List of 6 ## $ breaks : num [1:15] -3.5 -3 -2.5 -2 -1.5 -1 -0.5 0 0.5 1 ... ## $ counts : int [1:14] 3 6 21 36 96 141 192 195 143 89 ... ## $ density : num [1:14] 0.006 0.012 0.042 0.072 0.192 0.282 0.384 0.39 0.286 0.178 ... ## $ mids : num [1:14] -3.25 -2.75 -2.25 -1.75 -1.25 -0.75 -0.25 0.25 0.75 1.25 ... ## $ xname : chr "a" ## $ equidist: logi TRUE ## - attr(*, "class")= chr "histogram"If I wanted to extract something from that I could use
b <- h$breaksIf you really only want one thing out of the list, you could do something like
b <- hist(a, plot=FALSE)$breaksYou can use
.’s in variable and function names, but I don’t recommend you do. Often a function with a.in it means that it applies a “generic” operation to a specific class. For example, theplot()function is a straightforward way of plotting data, much like in matlab. However, there exist lots of variants ofplotfor different classes, which are usually specified asplot.class(). E.g. for the histogram object I created above, if I want to plot it, I can just doh2 <- hist(a, plot=FALSE, breaks=100) plot(h2, main='A plot with more breaks')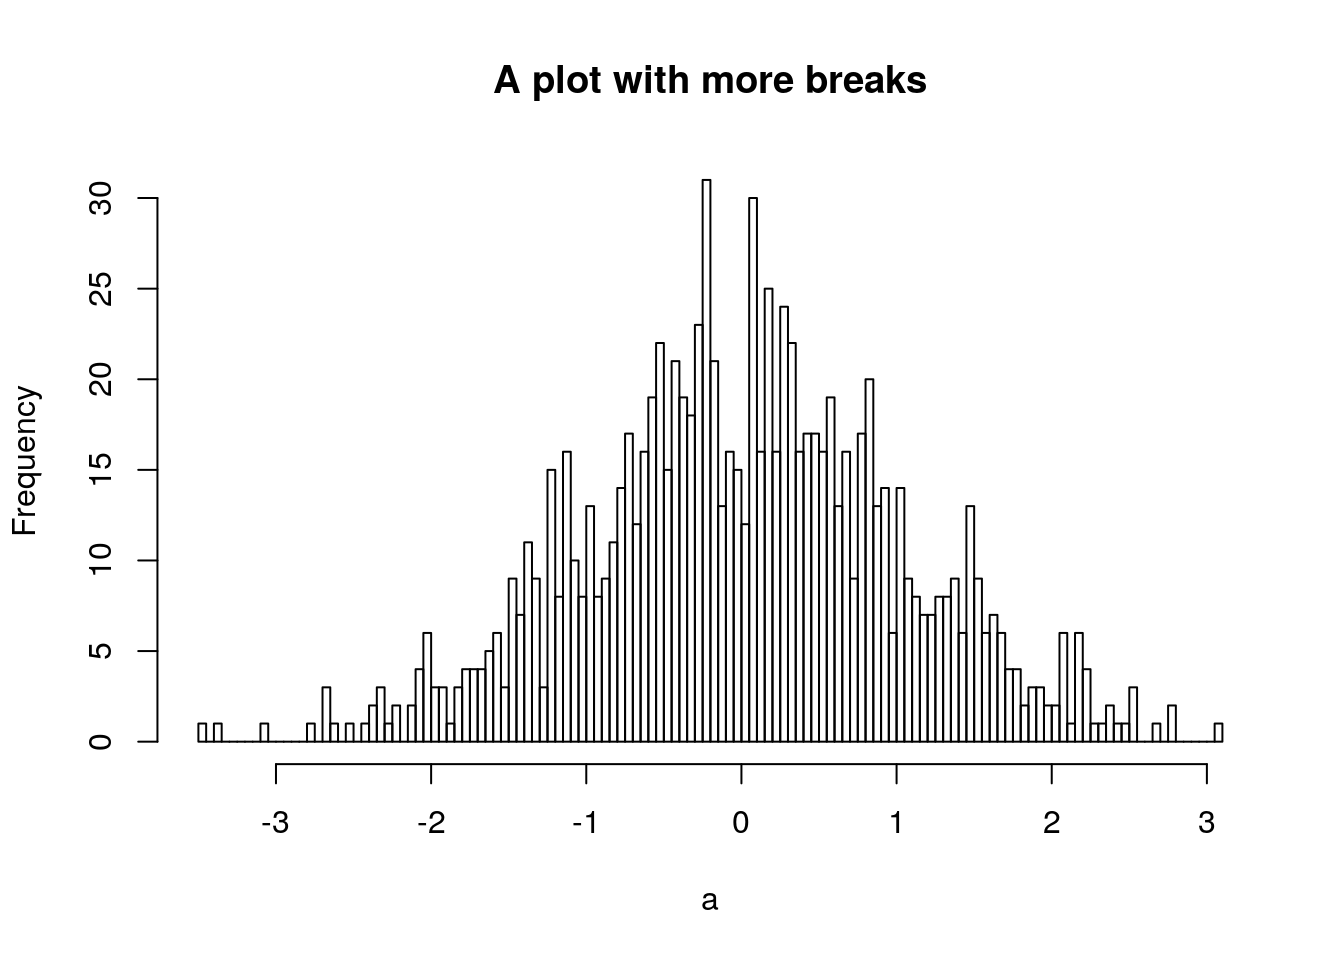 and it will plot it as a histogram, using the generic function
plot.histogram(), as well as accept the arguments appropriate to that generic function.
Thoughts on topics for future editions of matlab2R
plotting, including:
- points, lines, styles, etc
- “image”-style plots, contours, filled contours, colormaps, etc
POSIX times vs Matlab
datenum… suggestions in comments?