In fall 2023, I hosted my friend Igor Shkvorets for a visit and tour at the Bedford Institute of Oceanography. Igor and I had previously worked together at RBR in Ottawa, where I had worked my first job (after postdoc) as a research oceanographer. Igor was the calibration guru at RBR – he knew more about CTDs, calibrations, standard seawater, electrical conductivity, practical salinity, etc than anyone else I have met. We spent many afternoons at RBR sipping espresso and discussing the finer details of seawater conductivity corrections and how to best measure it with an inductive (i.e. RBR-style) conductivity cell.
Igor and his wife Irina had set sail some weeks earlier from Ottawa in their sailboat, the “Oceanolog”, with the dual purpose of taking advantage of his recent retirement from RBR and to promote his “Sail for Science” project. After the tour at BIO (which you can read about on his blog), we headed back to the Dartmouth Yacht Club for a tour of his beautiful boat and to reminisce over a pot of coffee (pressed, instead of espresso, but just as good). During the discussion, Igor mentioned that he and Irina were intending to sail to the Caribbean, and it occurred to me that it would be really neat if I could get them to deploy an Argo float for us when they got there1.
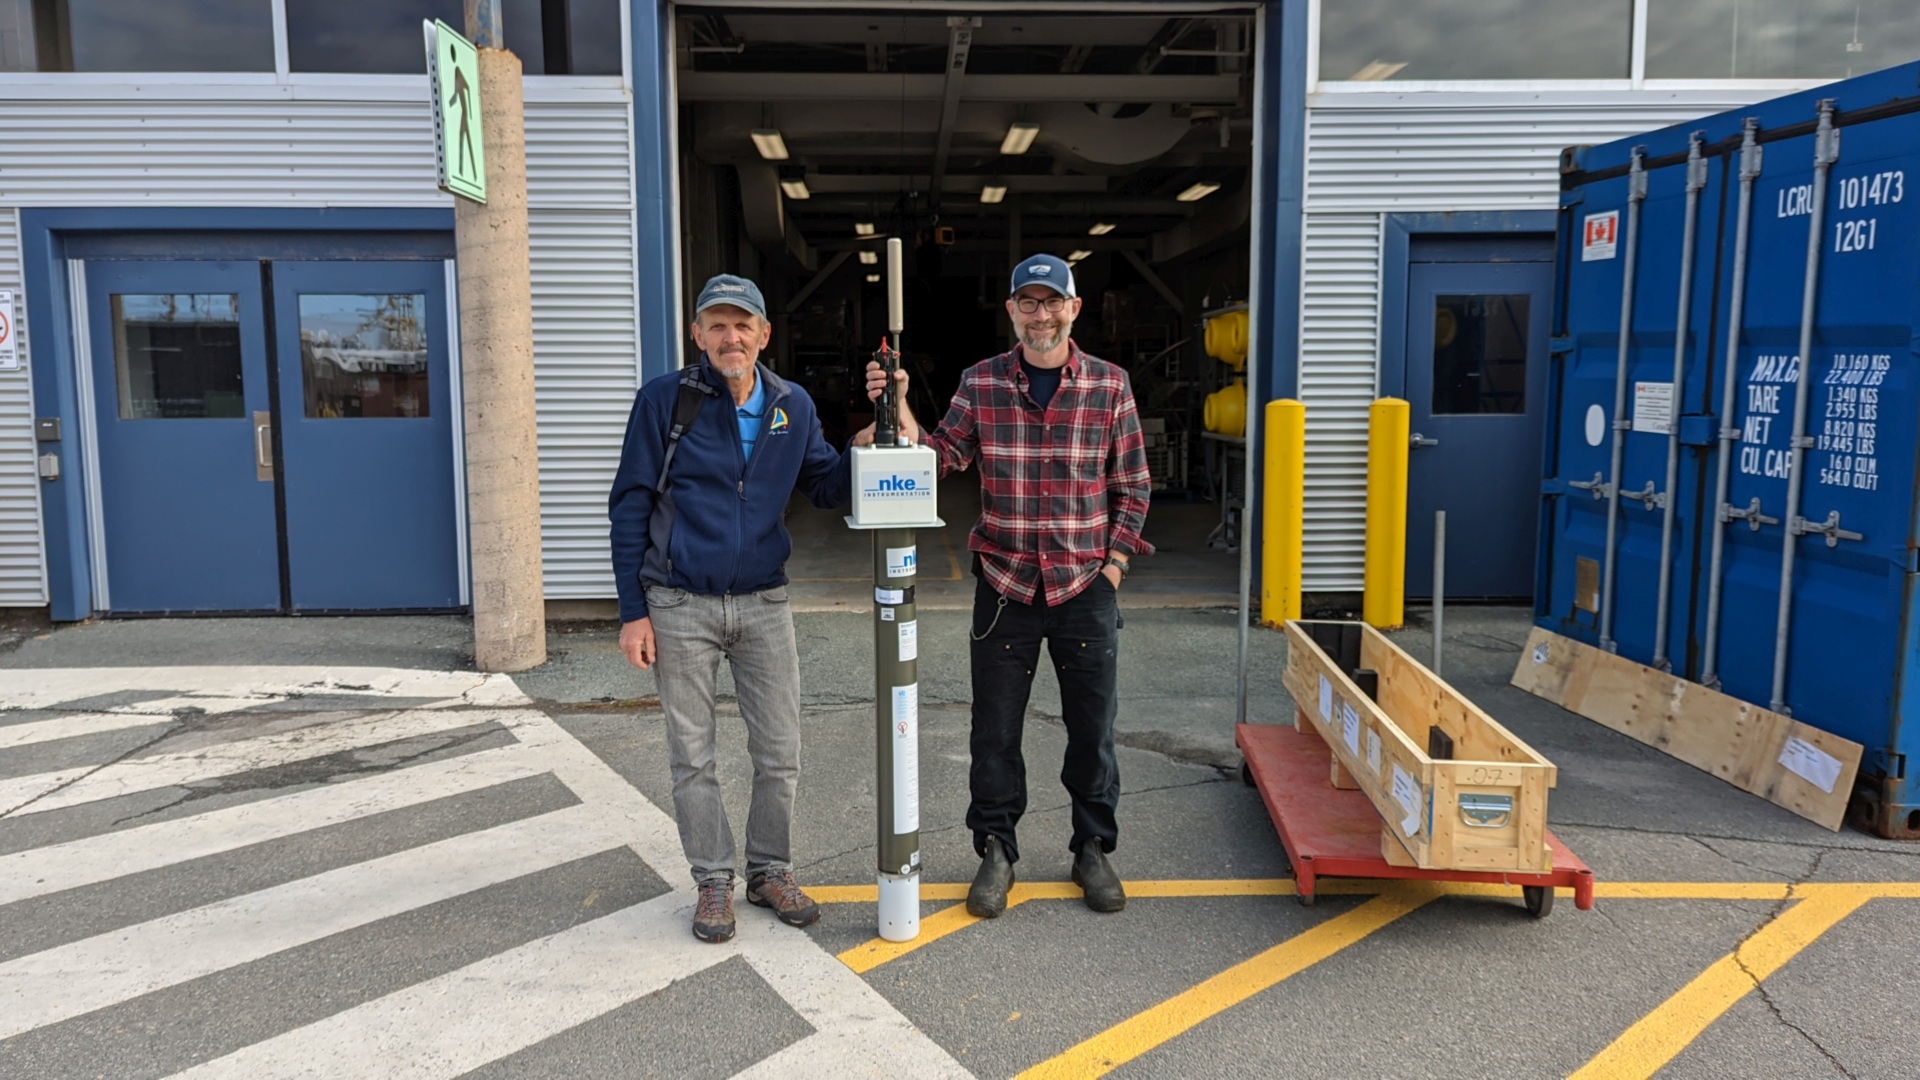
So, the next day, Igor and I got organized to select, test, and load one of the Argo Canada Arvor floats (manufactured by NKE) from BIO:
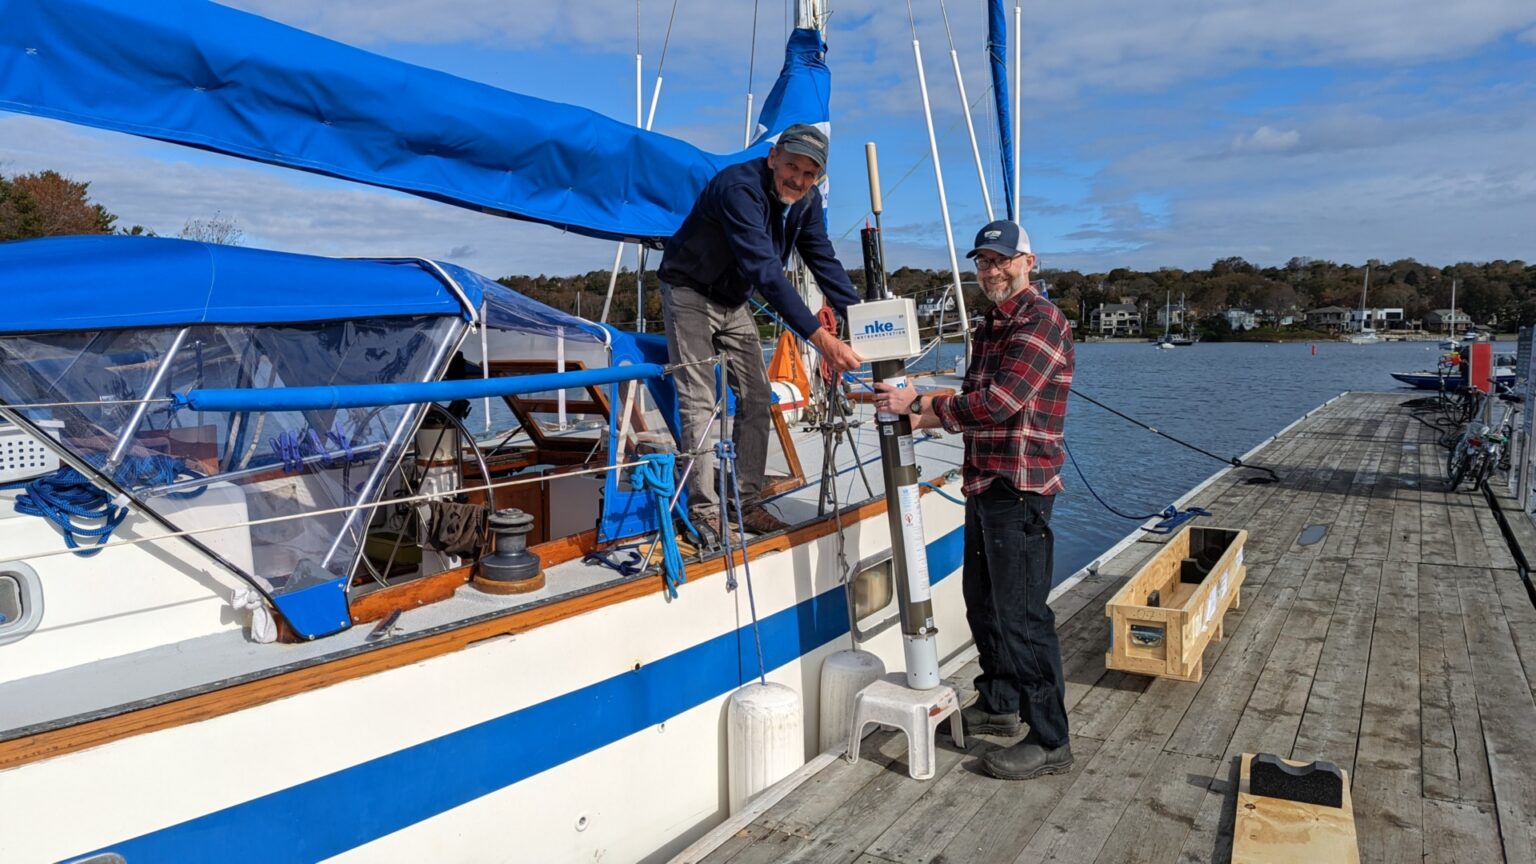
After testing, we drove the float over to the Armdale Yacht Club (where Igor had since moved), and loaded into the “oceanography lab” on the Oceanolog.
Deploying the float
I won’t go through all the details, as Igor covered them quite nicely in his own blog post, but several months later, after much sailing, Igor and Irina were able to deploy the float.
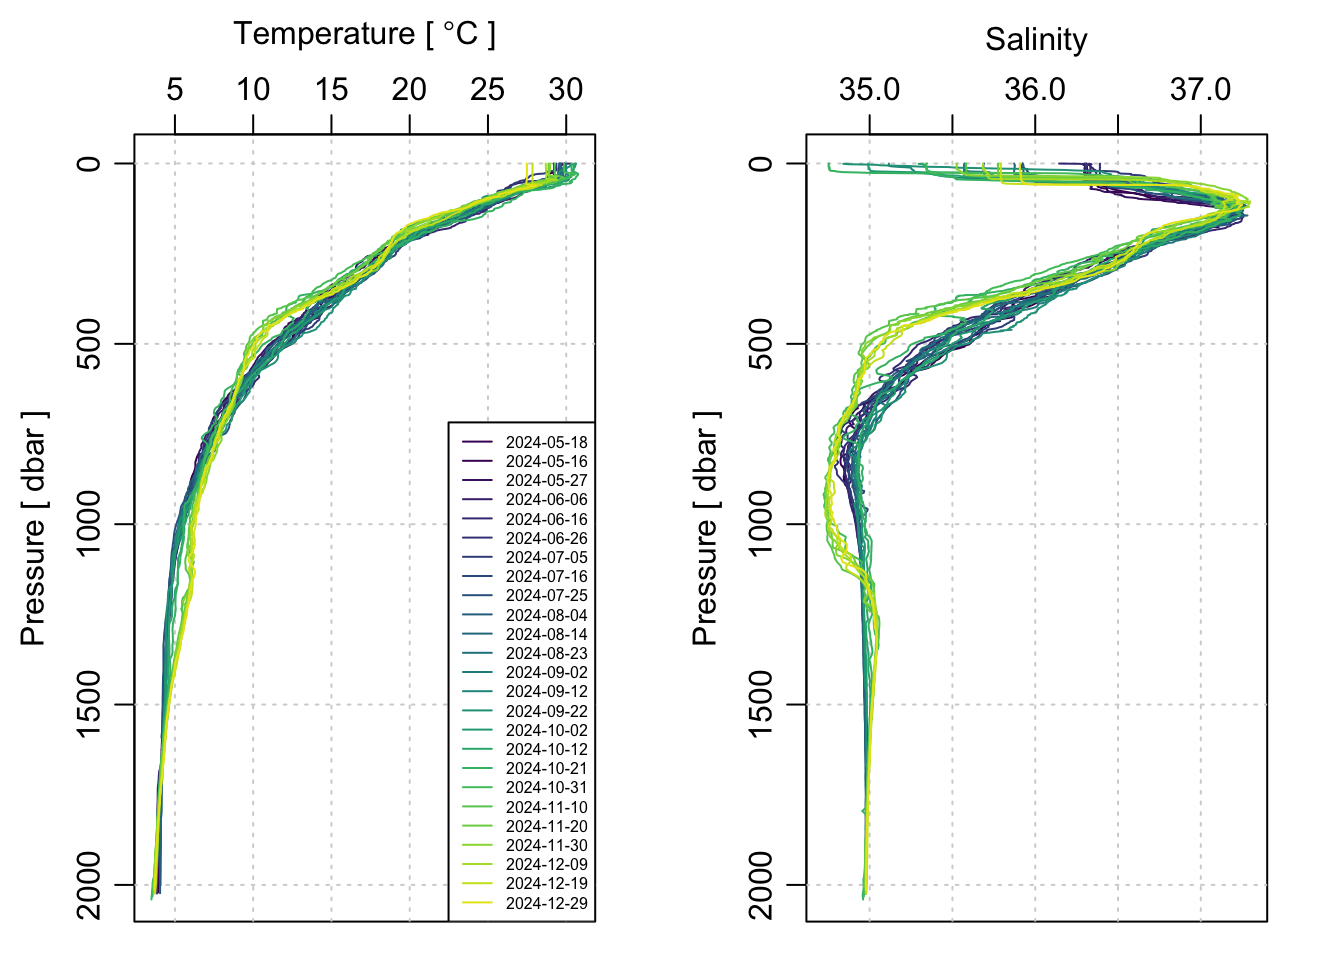
To see the data from Igor’s float (ID 4902609), we can use the argoFloats package in R:
library(oce)
library(argoFloats)

a <- getIndex() |>
    subset(ID = 4902609) |>
    getProfiles() |>
    readProfiles()
ctd <- a[["argos"]] |> lapply(as.ctd)

par(mfrow = c(1, 2))

times <- sapply(ctd, "[[", "startTime") |> numberAsPOSIXct()
cm <- colormap(times)
Tlim <- range(sapply(ctd, "[[", "temperature"), na.rm = TRUE)
Slim <- range(sapply(ctd, "[[", "salinity"), na.rm = TRUE)

plotProfile(ctd[[1]], xtype = "temperature", lty = 0, Tlim = Tlim)
for (i in seq_along(ctd)) {
    plotProfile(ctd[[i]], xtype = "temperature", col = cm$zcol[i], add = TRUE)
}
abline(v = -1.21, lty = 2)
legend("bottomright", format(times, "%Y-%m-%d"), lty = 1, col = cm$zcol, cex = 0.5)
plotProfile(ctd[[1]], xtype = "salinity", lty = 0, Slim = Slim)
for (i in seq_along(ctd)) {
    plotProfile(ctd[[i]], xtype = "salinity", col = cm$zcol[i], add = TRUE)
}
We can look at a map of the profile locations with:
plot(a, pch = 19, col = 2)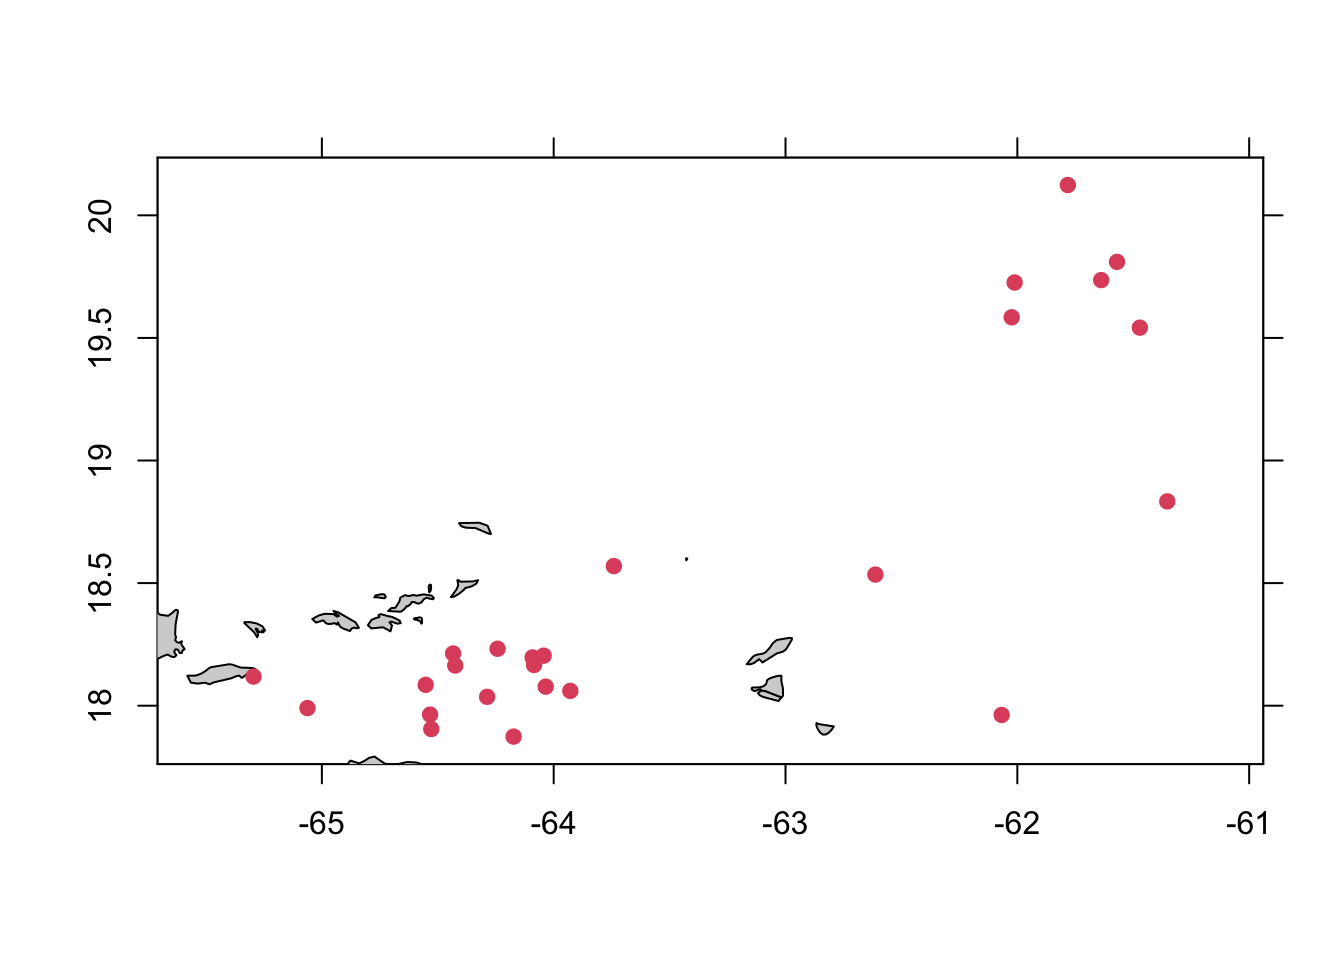 where we can see that (unfortunately) the float didn’t actually stay in the Caribbean but got carried out between the island chain and is now drifting in the western Atlantic. Oh well.
There are a few ways to make a TS plot summary of the data, the easiest of which is to use functionality in the argoFloats package directly:
plot(a, which = "TS", TSControl = list(groupByCycle = TRUE), col = cm$zcol)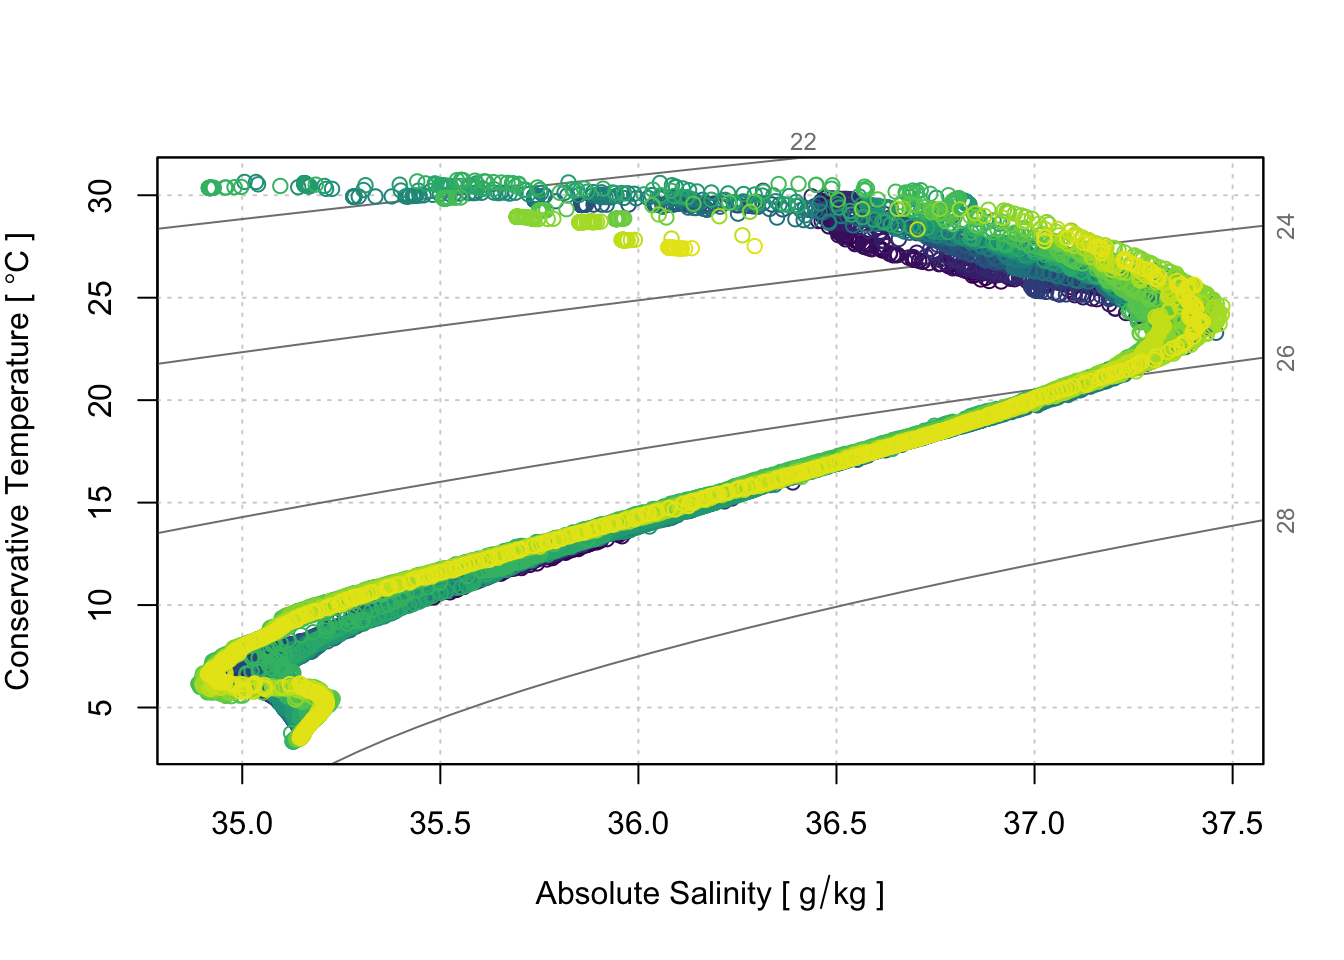
## NULLThe Caribbean is typically under sampled by Argo, so opportunities to deploy floats there are always welcome.↩︎