Introduction
I need to write a proper intro here, but this is just a placeholder to see if my long-neglected Hugo site is still going to compile and build properly.
For some reason, and I’m not sure that this is a new issue, the “home page preview” of the most recent posts really mangles any code chunks that show up in it.
Hawaiian Ocean Timeseries WireWalker data
library(oce)## Loading required package: gswlibrary(readr)
library(cmocean)
d <- read_csv('HOT297_data_L1_v1_0.csv.zip')## Rows: 507302 Columns: 17## ── Column specification ────────────────────────────────────────────────────────────────────────────────
## Delimiter: ","
## dbl (16): latitude, longitude, depth, cast, pressure, temperature, conserva...
## dttm (1): time
##
## ℹ Use `spec()` to retrieve the full column specification for this data.
## ℹ Specify the column types or set `show_col_types = FALSE` to quiet this message.ww <- with(d,
as.ctd(salinity=practical_salinity,
temperature=temperature,
pressure=pressure,
time=as.POSIXct(time, tz='UTC'),
latitude=latitude,
longitude=longitude,
station="HOT"))
ww <- oceSetData(ww, 'fluorescence', d$fluorescence)
ww <- oceSetData(ww, 'backscattering', d$backscattering)
ww <- oceSetData(ww, 'oxygen', d$oxygen)
ww <- oceSetData(ww, 'cdom', d$CDOM)
ww <- oceSetData(ww, 'par', d$PAR)
ww <- oceSetData(ww, 'sigmaTheta', swSigmaTheta(ww))
ww <- oceSetData(ww, 'N2', swN2(ww))movingAverage <- function(x, n = 11, ...)
{
f <- rep(1/n, n)
stats::filter(x, f, ...)
}
prof <- ctdFindProfiles(ww, smoother=movingAverage, direction = 'ascending')
prof <- lapply(prof, \(x) oceSetMetadata(x, 'startTime', x[['time']][1]))
prof <- lapply(prof, \(x) {
oceSetMetadata(x, 'startTime', x[['time']][1]) |>
oceSetMetadata('latitude', x[['latitude']][1]) |>
oceSetMetadata('longitude', x[['longitude']][1])
})t <- numberAsPOSIXct(sapply(prof, '[[', 'startTime'))
p <- seq(0.5, 400, 0.25)
profg <- lapply(prof, ctdDecimate, p=p)
make_arrays <- function(x) {
t <- sapply(x, '[[', 'startTime')
p <- x[[1]][['pressure']]
N <- length(x)
fields <- names(x[[1]]@data)
out <- list()
for (i in seq_along(fields)) {
out[[i]] <- array(NA_real_, dim=c(length(t), length(p)))
}
names(out) <- fields
for (i in 1:N) {
for (f in fields) {
out[[f]][i, ] <- x[[i]][[f]]
}
}
return(out)
}
mat <- make_arrays(profg)
plot_field <- function(x, f, log=FALSE, ...) {
imagep(t, p, if (log) log(x[[f]]) else x[[f]], flipy=TRUE, ...)
contour(t, p, x$sigmaTheta, add=TRUE)
}
plot_field(mat, 'temperature', col=cmocean('thermal'))## Warning in imagep(t, p, if (log) log(x[[f]]) else x[[f]], flipy = TRUE, :
## auto-decimating second index of large image by 3; use decimate=FALSE to prevent
## this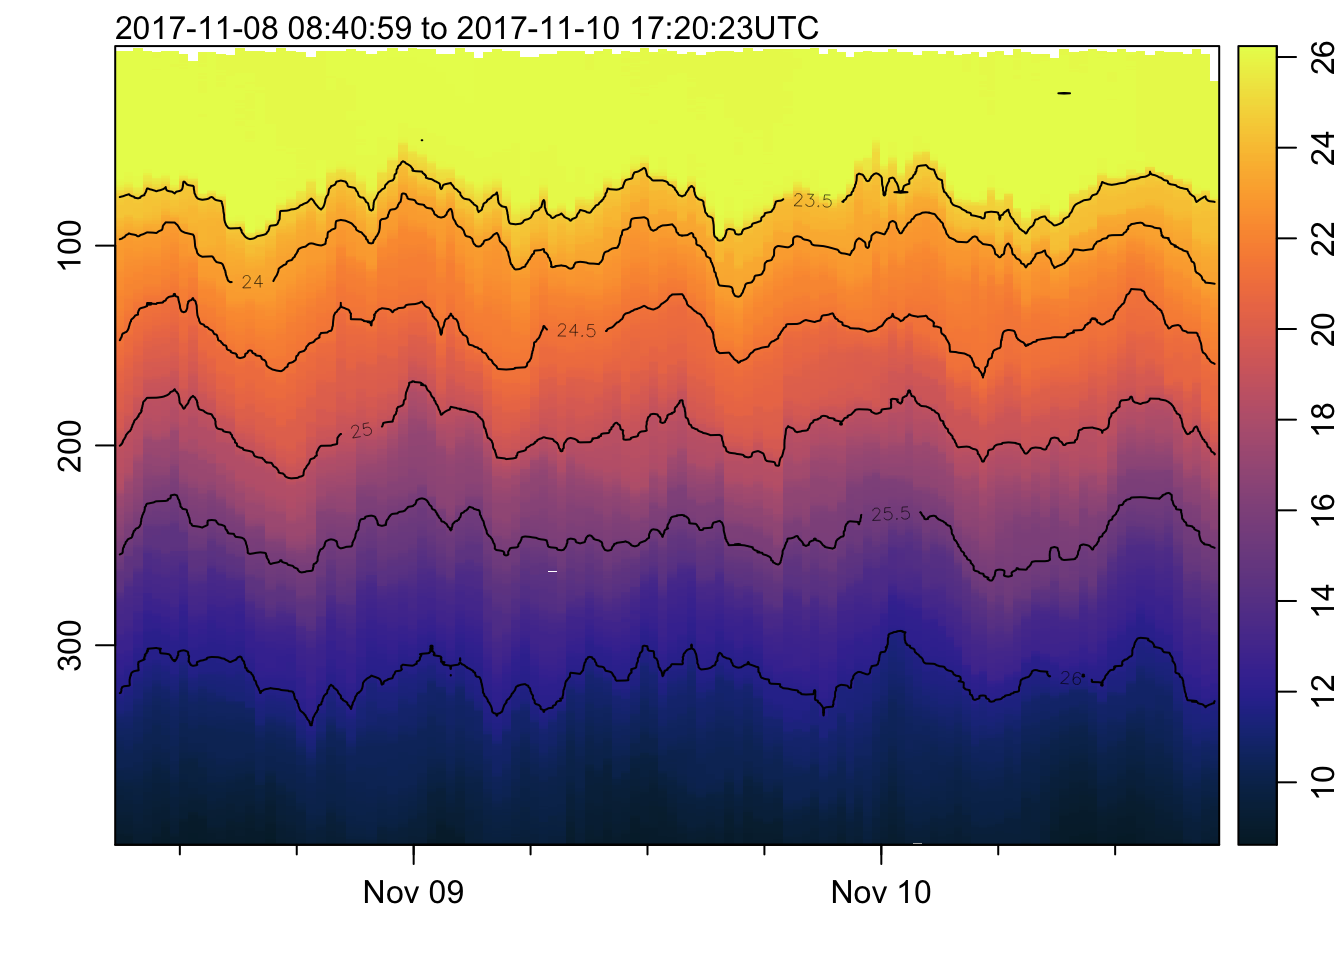
plot_field(mat, 'salinity', col=cmocean('haline'))## Warning in imagep(t, p, if (log) log(x[[f]]) else x[[f]], flipy = TRUE, :
## auto-decimating second index of large image by 3; use decimate=FALSE to prevent
## this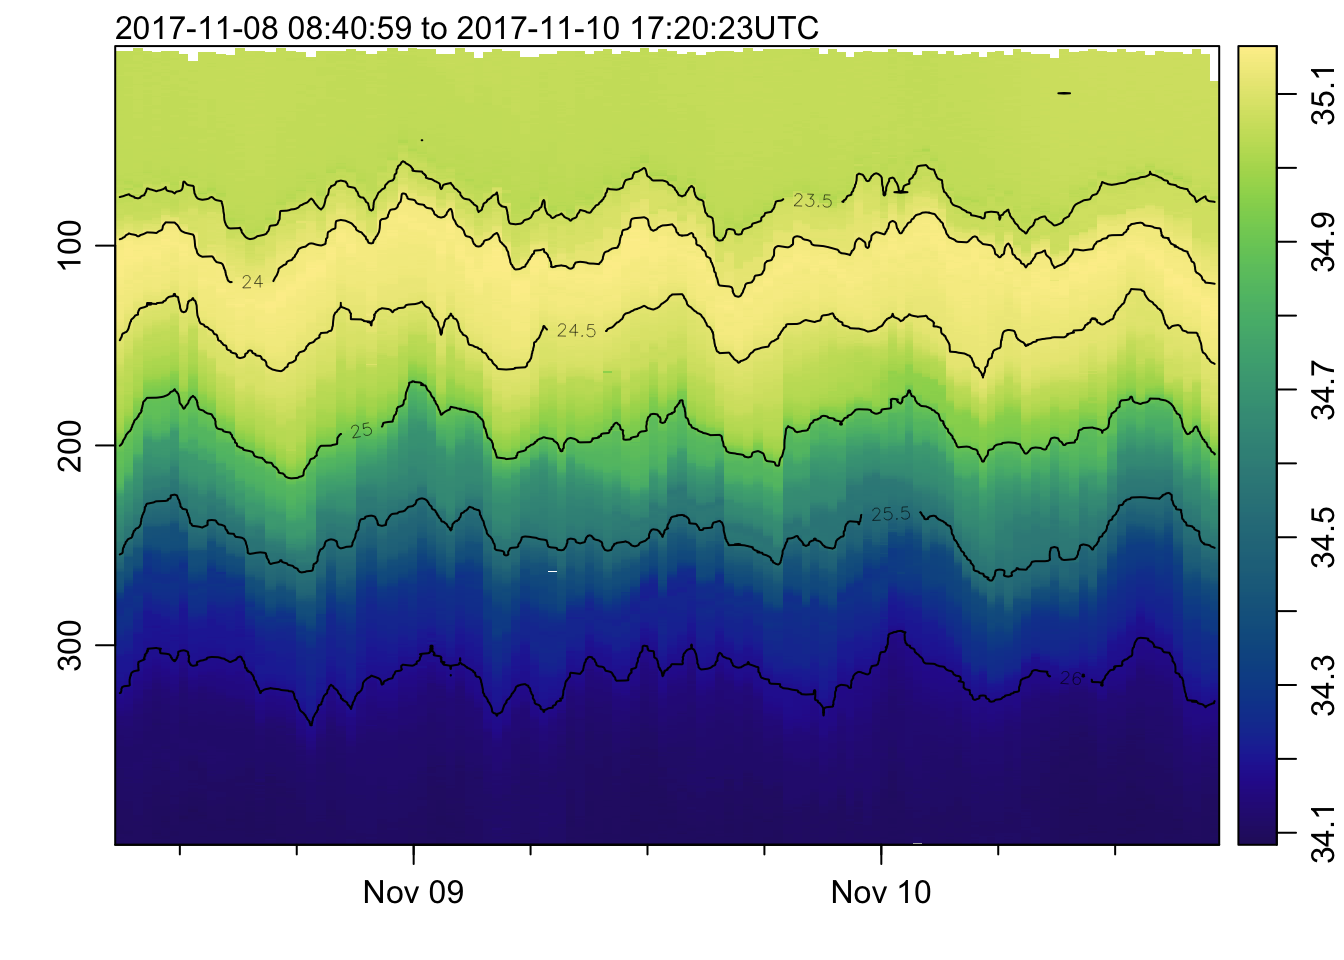
plot_field(mat, 'sigmaTheta', col=cmocean('dense'))## Warning in imagep(t, p, if (log) log(x[[f]]) else x[[f]], flipy = TRUE, :
## auto-decimating second index of large image by 3; use decimate=FALSE to prevent
## this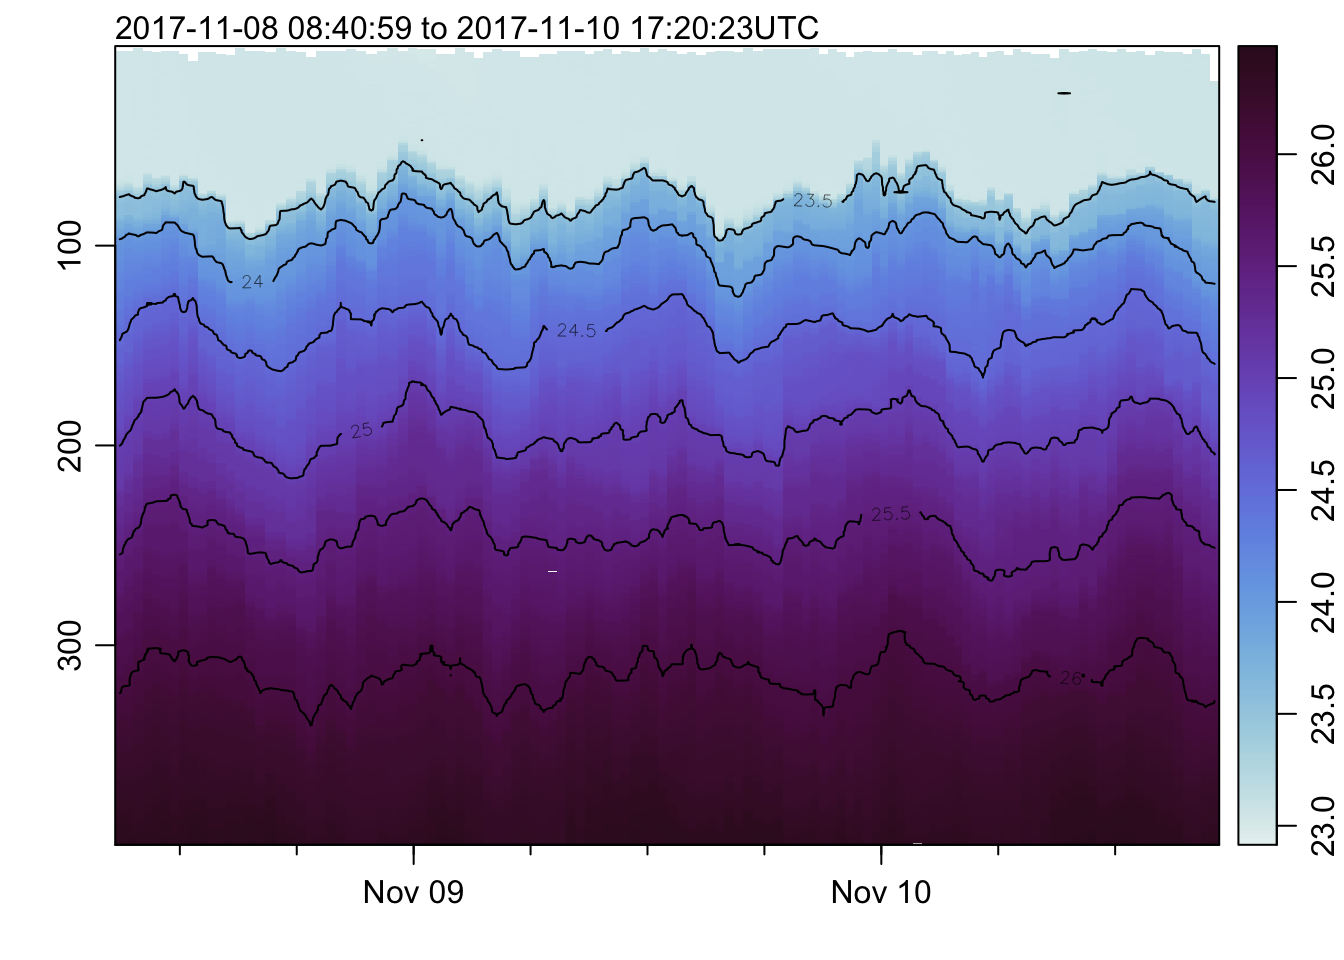
plot_field(mat, 'N2', log=!TRUE, zlim=c(0, 0.5e-4))## Warning in imagep(t, p, if (log) log(x[[f]]) else x[[f]], flipy = TRUE, :
## auto-decimating second index of large image by 3; use decimate=FALSE to prevent
## this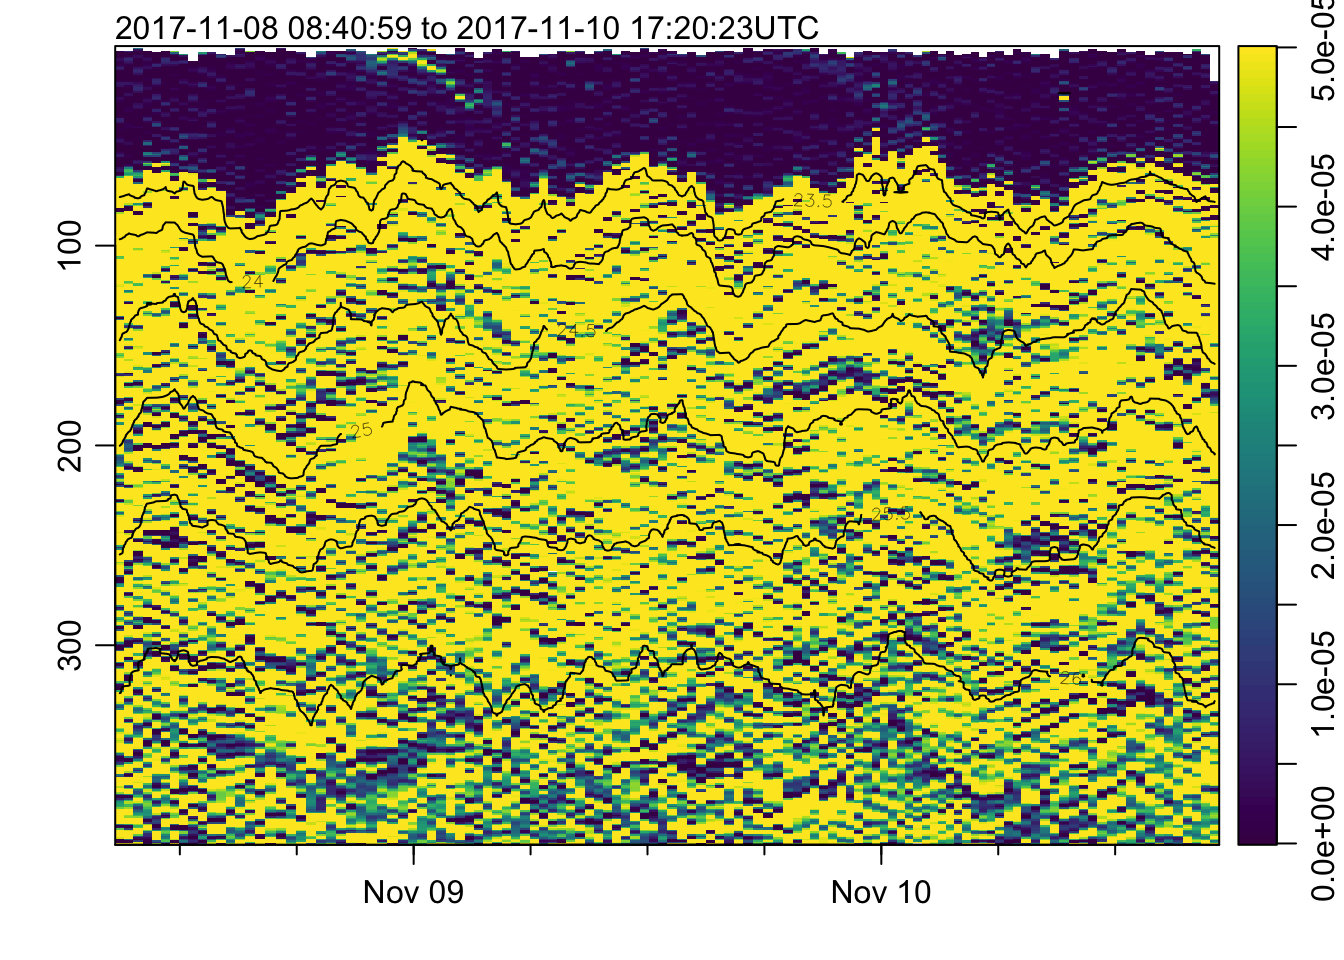
plot_field(mat, 'oxygen', col=cmocean('oxy'))## Warning in imagep(t, p, if (log) log(x[[f]]) else x[[f]], flipy = TRUE, :
## auto-decimating second index of large image by 3; use decimate=FALSE to prevent
## this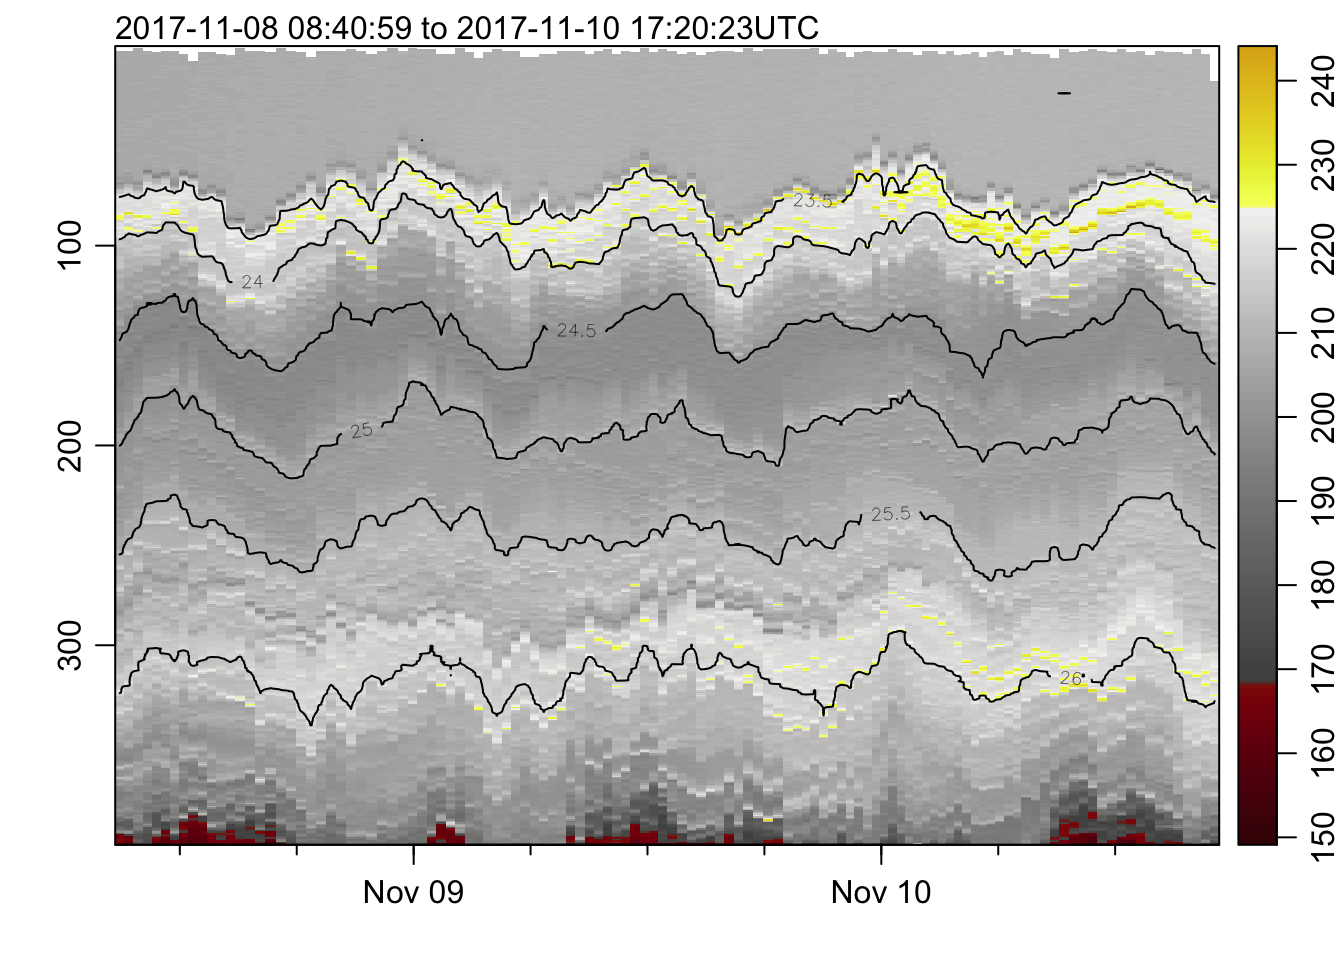
plot_field(mat, 'fluorescence', col=cmocean('algae'))## Warning in imagep(t, p, if (log) log(x[[f]]) else x[[f]], flipy = TRUE, :
## auto-decimating second index of large image by 3; use decimate=FALSE to prevent
## this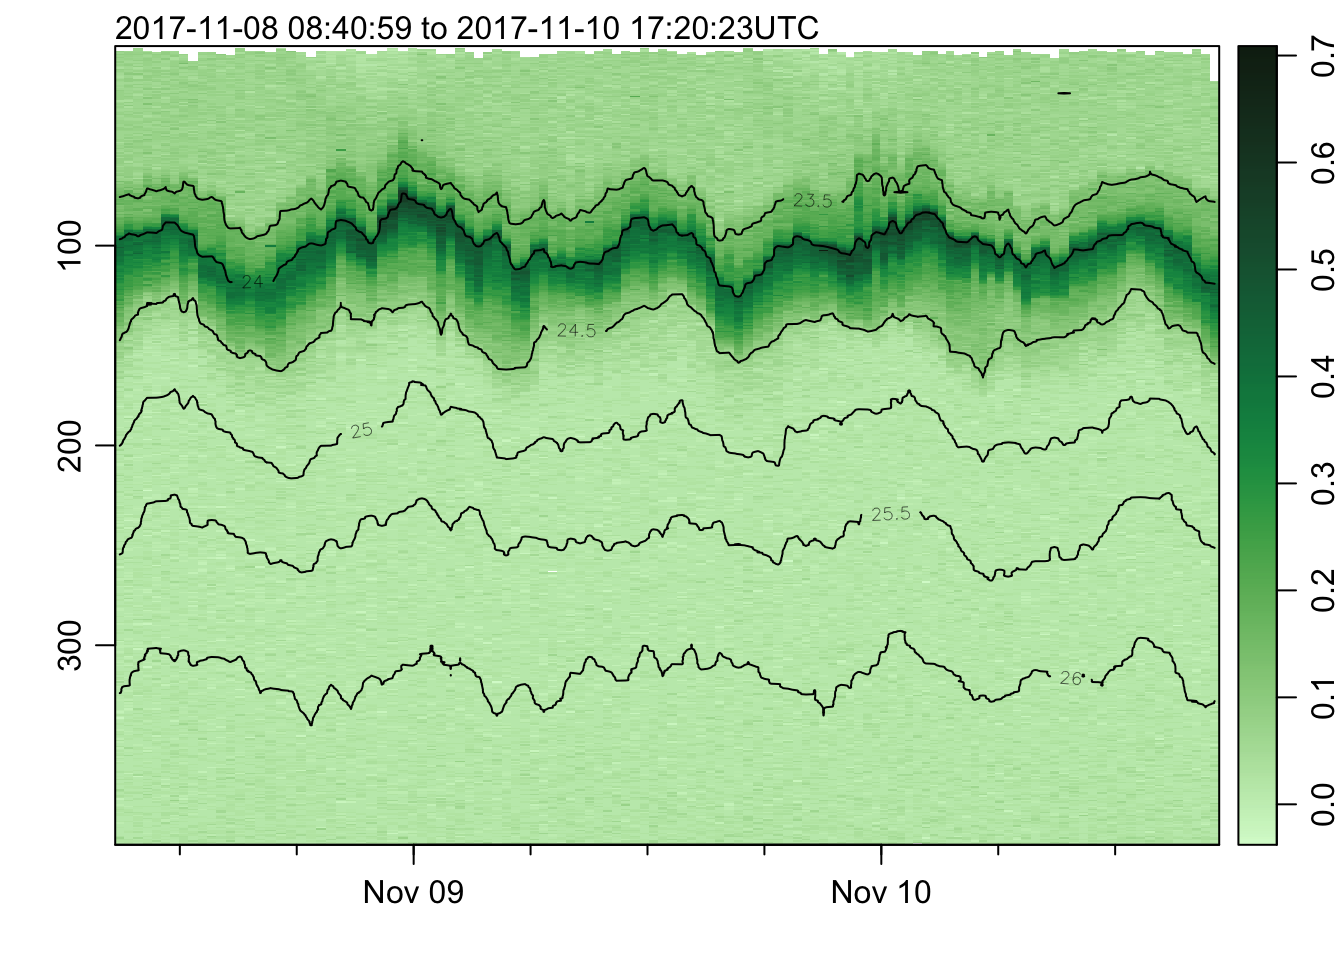
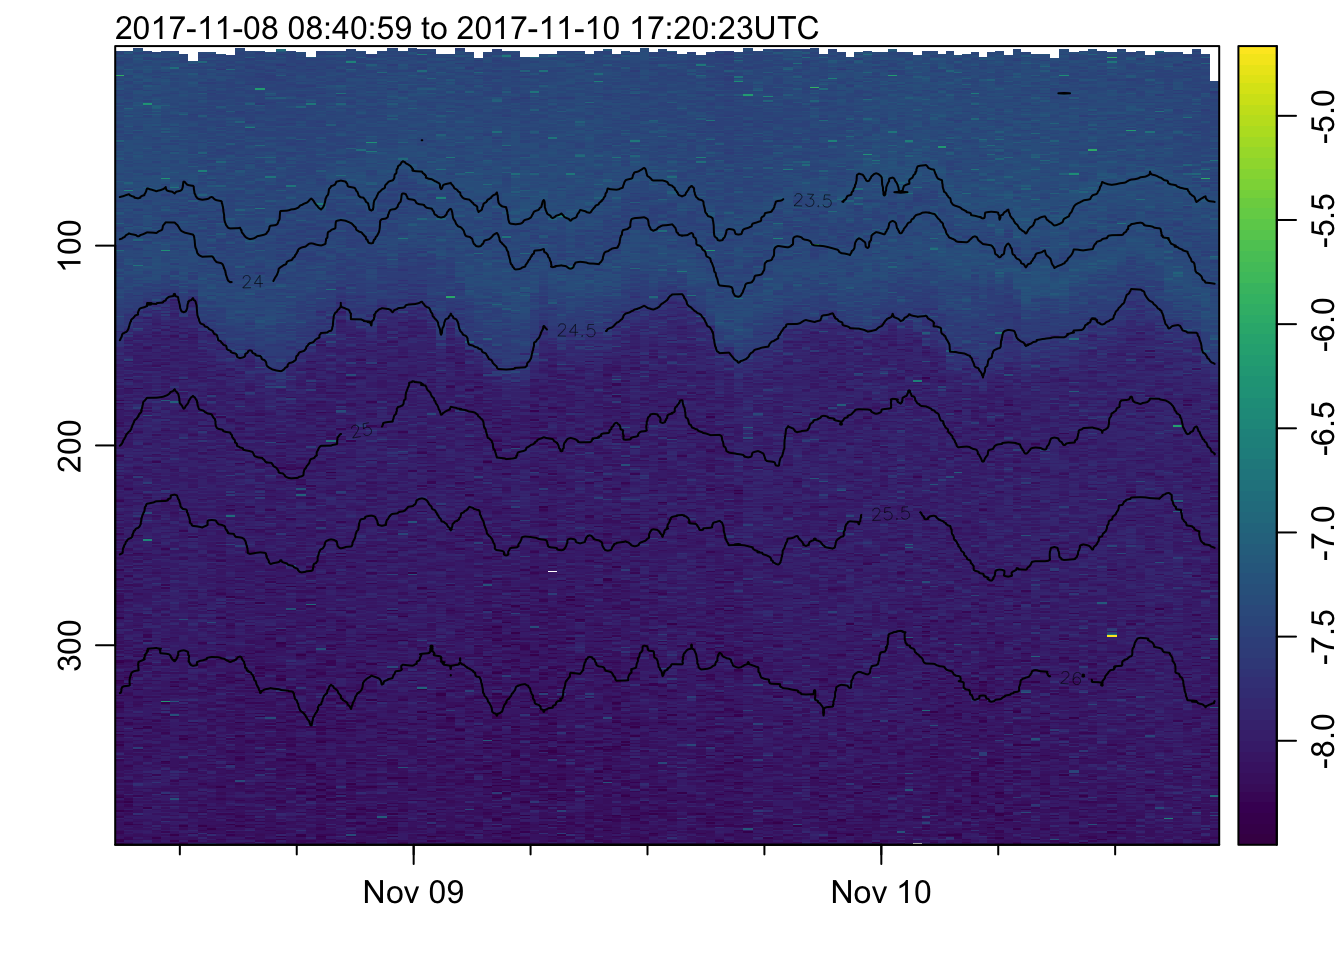
plot_field(mat, 'cdom', log=TRUE)## Warning in log(x[[f]]): NaNs produced
## Warning in log(x[[f]]): auto-decimating second index of large image by 3; use
## decimate=FALSE to prevent this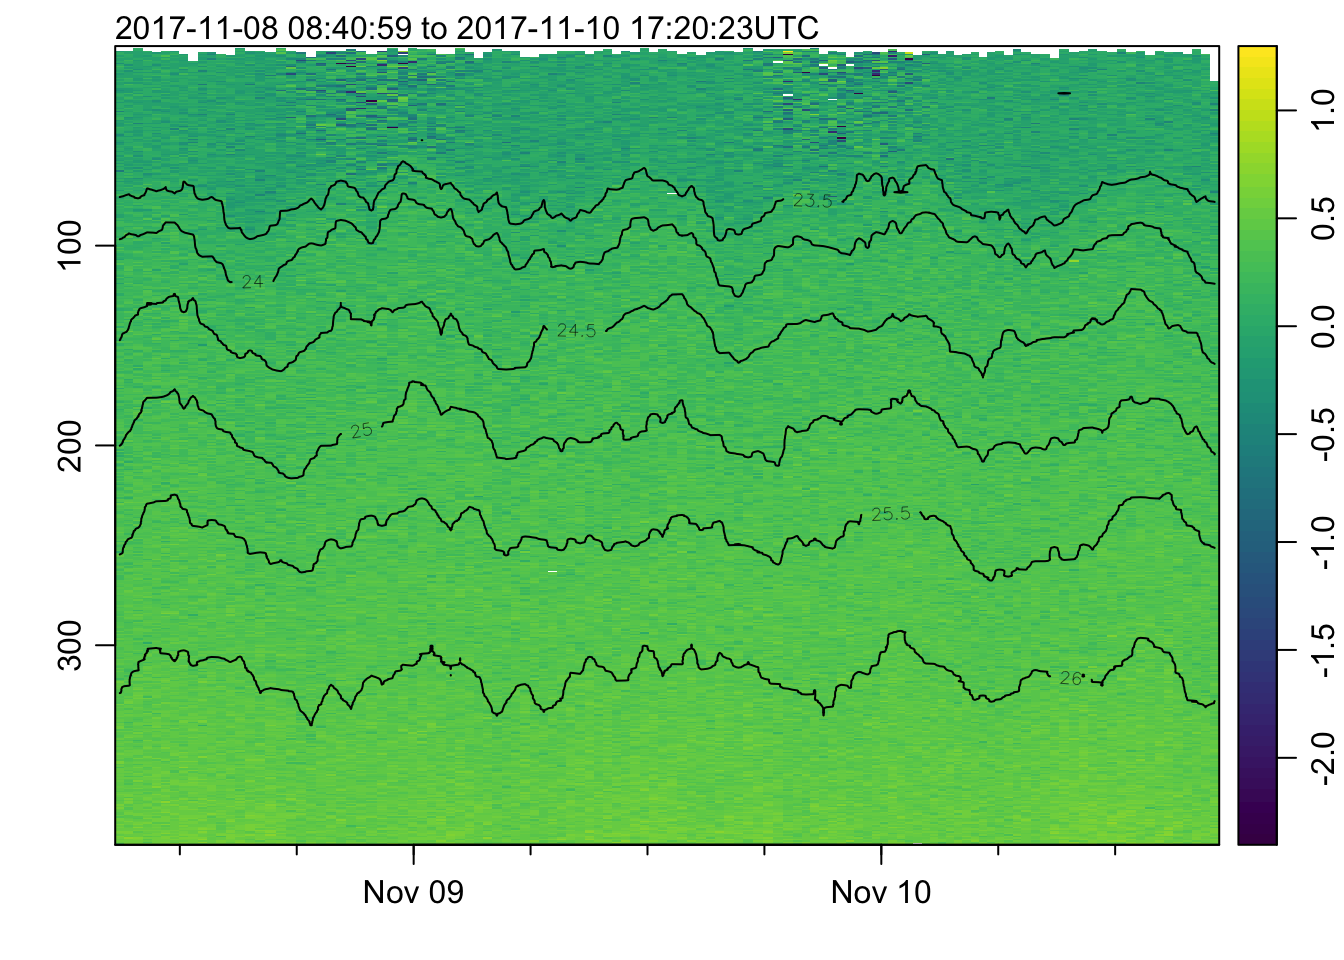
plot_field(mat, 'par', log=!TRUE)## Warning in imagep(t, p, if (log) log(x[[f]]) else x[[f]], flipy = TRUE, :
## auto-decimating second index of large image by 3; use decimate=FALSE to prevent
## this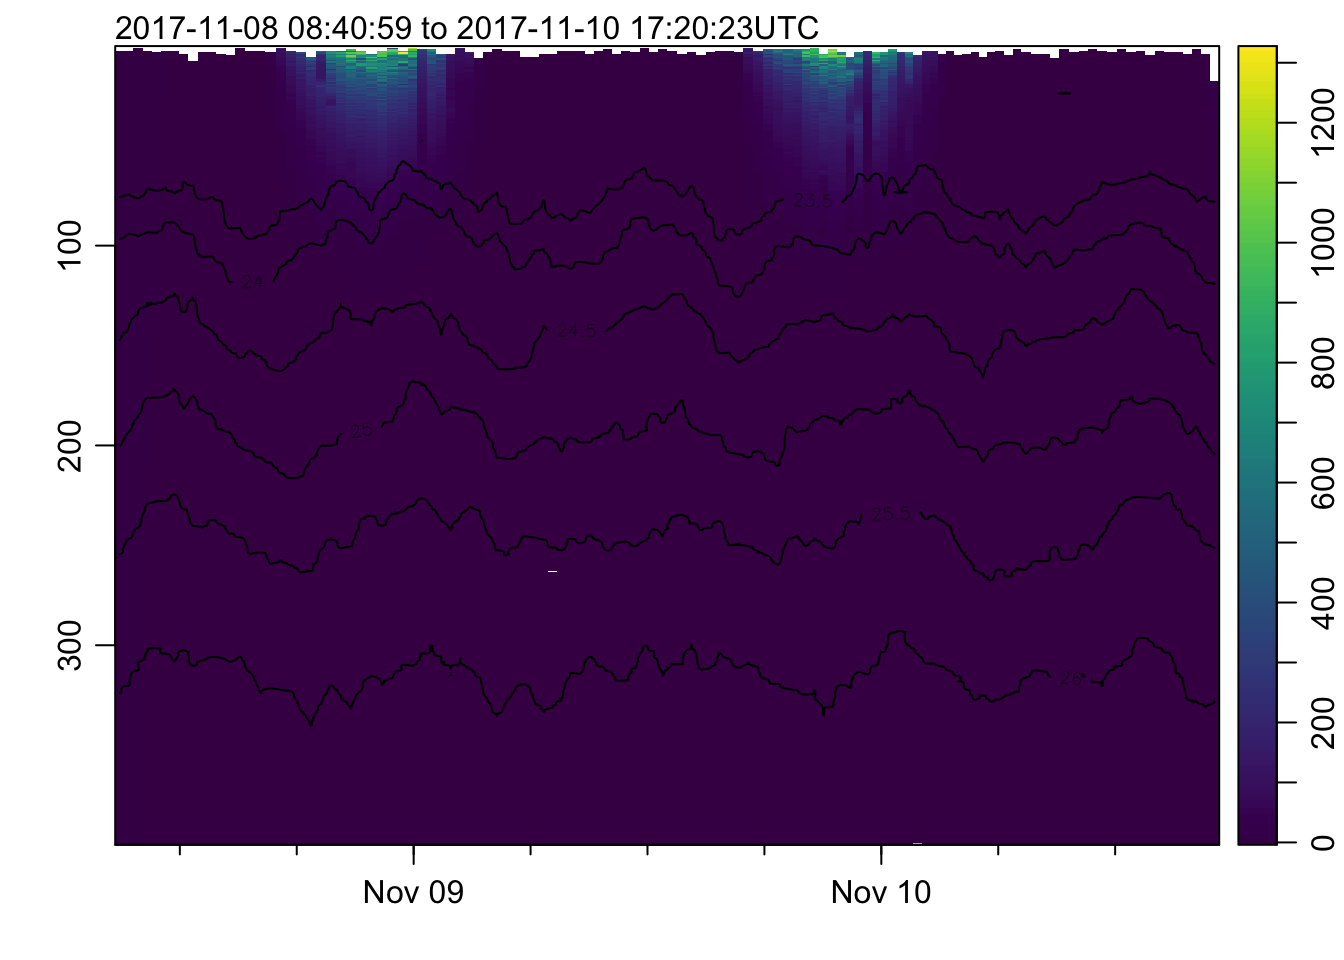
plot_field(mat, 'backscattering', log=TRUE)## Warning in log(x[[f]]): NaNs produced
## Warning in log(x[[f]]): auto-decimating second index of large image by 3; use
## decimate=FALSE to prevent this